
Phase Identification Quantitative XRD Semi-Quantitative XRD (RIR) Percent Crystallinity/Crystallite Size
Phase Identification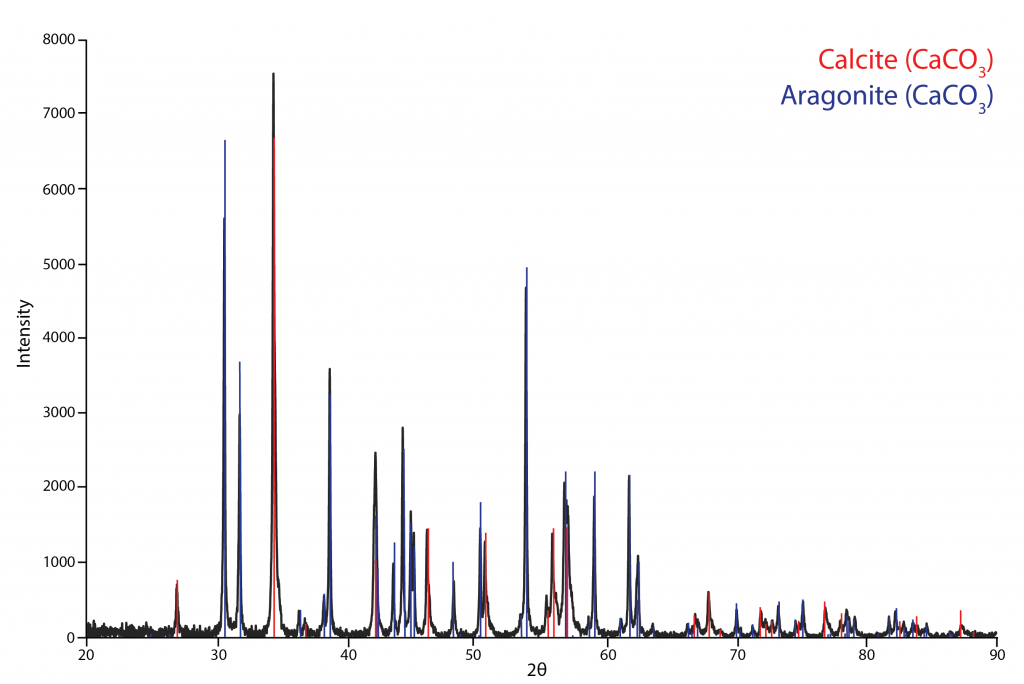
Phases are identified by taking an unknown sample's diffraction pattern and search/matching it against an XRD database. Phases are matched one by one until all the diffraction peaks in a sample have been identified.
Conditions/Assumptions
- Crystallites are randomly orientated
- Sample has been sufficiently ground
- Sample has been properly mounted
- The sub sample given to the technician is representative of the whole sample
Limitations
- The limit of detection on the XRD is between 1 - 5 wt% depending on the quality of sample preparation and sample type
- You cannot tell the elemental composition quantitatively with powder XRD, other analytical techniques are needed for this i.e. XRF, EPMA, SEM
- You cannot resolve phases with identical structures and similar atomic sizes, additional information about the elemental composition are needed to resolve this
- Preferred Orientation - can minimize this with proper sample preparation and mounting, but can still be a factor distorting intensity ratios
- The more phases there are, the more difficult it is to properly identify
- The lower the abundance of a phase the more difficult it is to identify
Quantitative XRD - Rietveld Refinement
The sample's diffraction pattern is modeled using a least squares refinement to determine the amount of each phase contributing to the diffraction pattern, giving a semi-quantitative estimate of the phase abundances. Clays are particularly tricky to model due to the fact that their structure changes with varying conditions (i.e. humidity) and require extra care.
Conditions/Assumptions
- That you have an ideal diffraction pattern of that sample (No preferred orientation, crystallites are randomly orientated, 1 μm particle size, perfect sample mounting, high quality scan conditions)
- That all the phases in the sample have been identified and identified correctly
- Detailed structure information is available for all the phases identified
Limitations
- The more phases present in the sample, the more difficult the refinement becomes
- Phases below the limit of detection are not included in the analysis
- There is 2 wt% error associated with any of the estimates provided
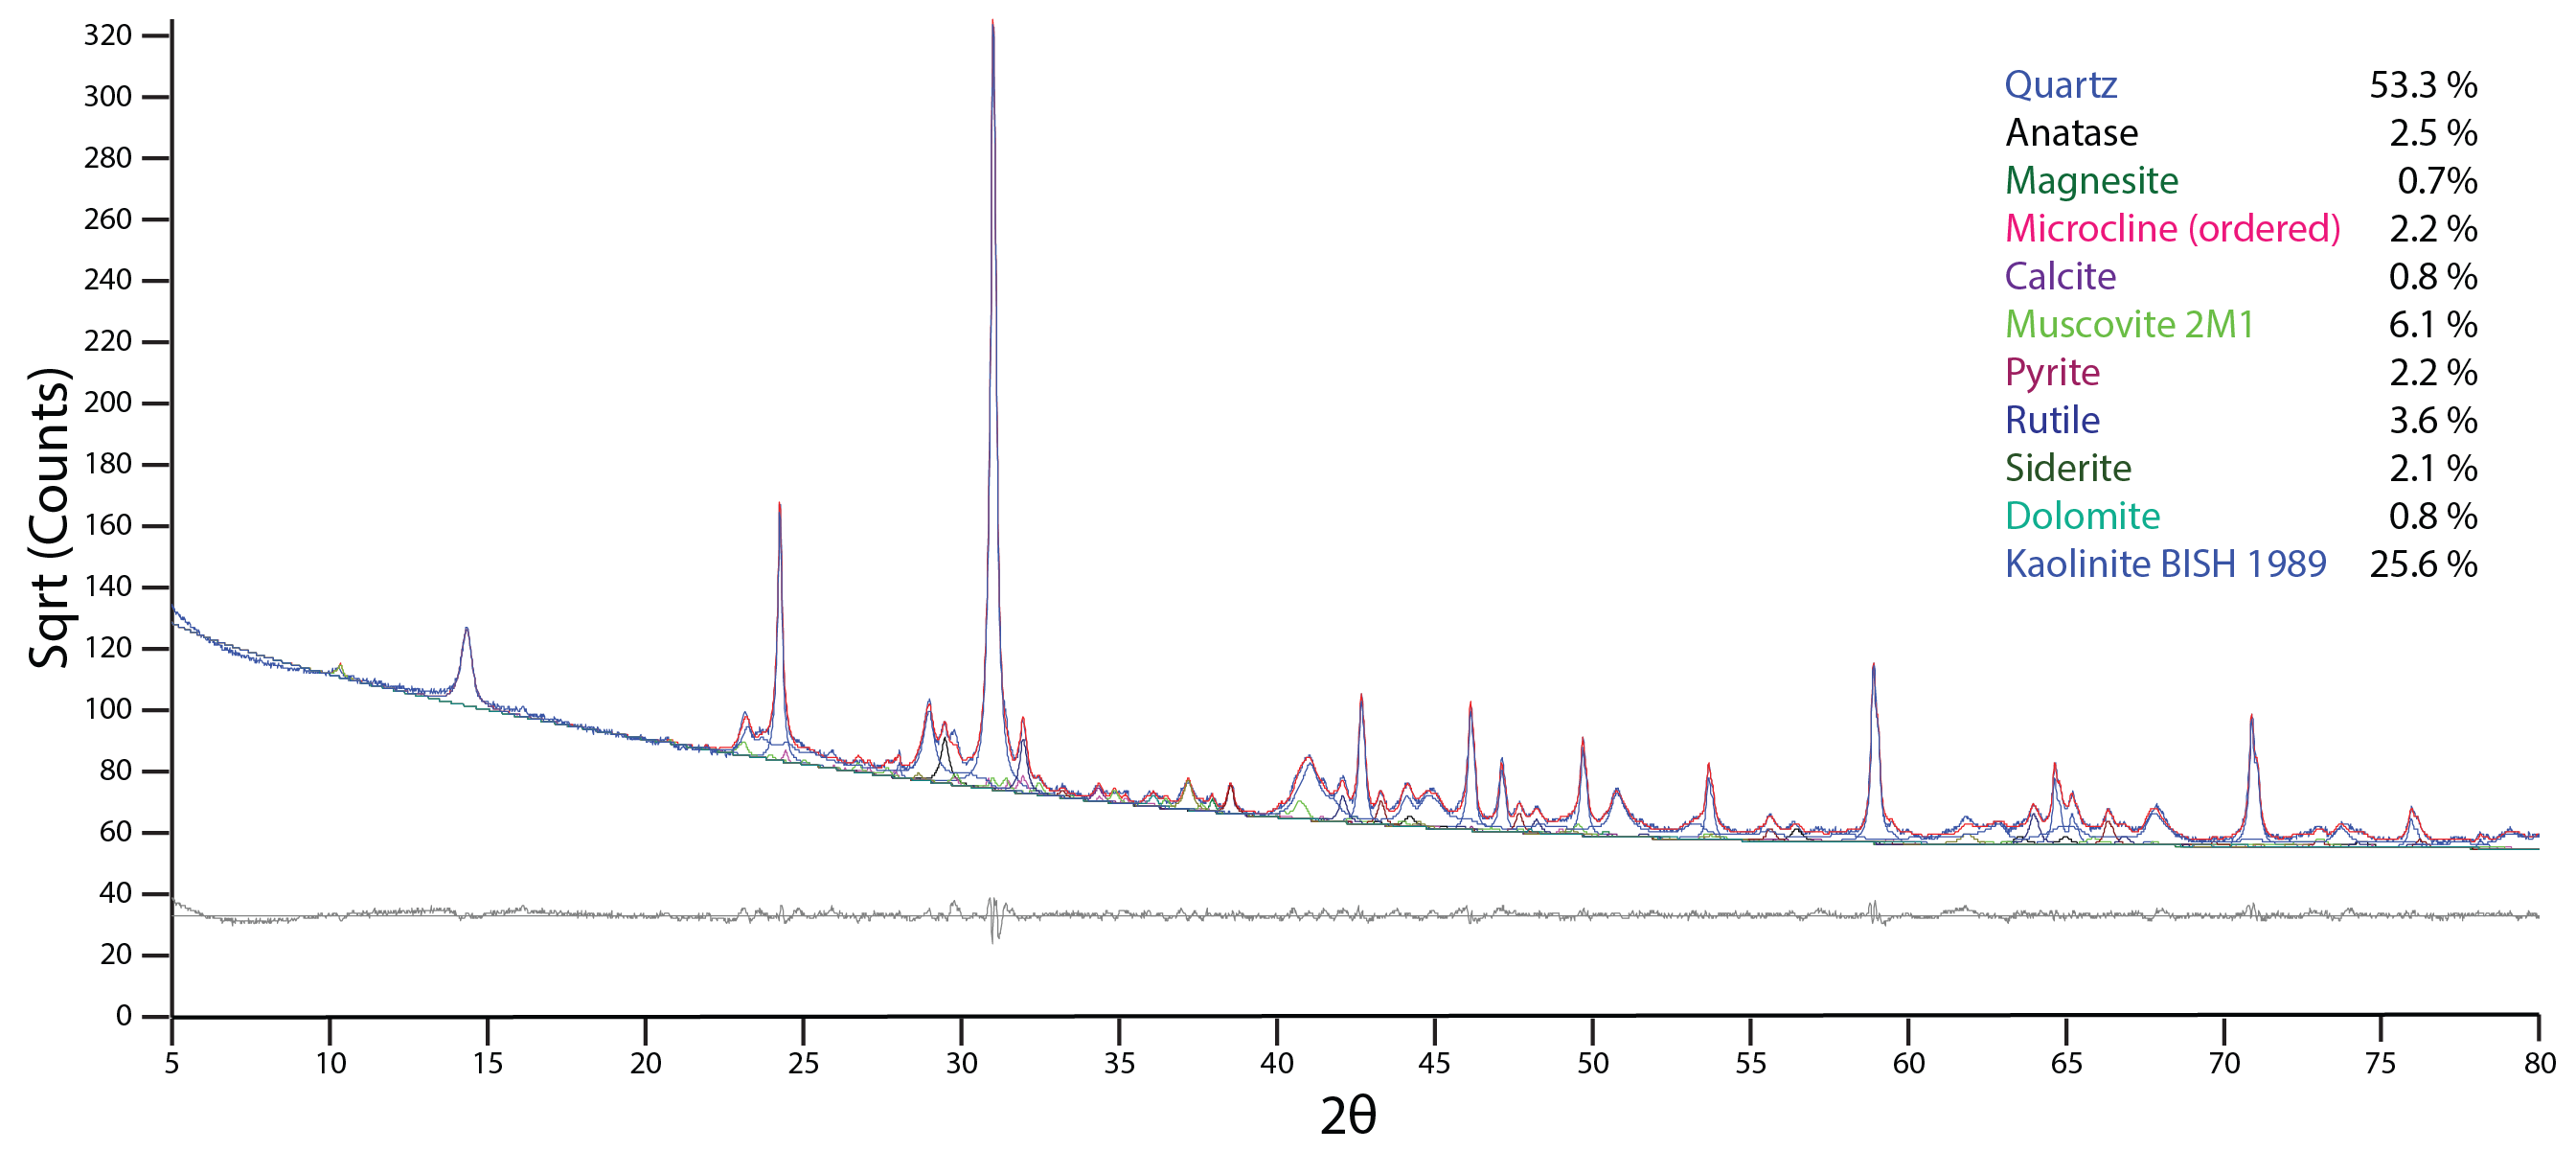
Semi-Quantitative XRD - Reference Intensity Ratios
Uses the ratio between intensity of the strongest peak of your identified phase compared and the strongest peak of a standard (corundum is internationally used) in a 50 - 50 mixture (I/Ic) to determine the abundance of that phase in a sample. The ratio I/Ic can be either experimentally derived or calculated theoretically. The ICDD has published the I/Ic ratios for over 10000 materials. Therefore the abundances of phases within a sample can be determined without an internal standard or with extensive modelling i.e. Rietveld Refinement.
Conditions/Assumptions
- That there is minimal to no preferred orientation
- That the crystallite size is the same for all the phases within the sample
- That there is a constant diffraction volume
Limitations
- Cannot resolve overlapping peaks as well as a Rietveld Refinement
- Cannot model preferred orientation or instrumental parameters, a Rietveld Refinement can
- Larger error associated with RIR compared to a Rietveld Refinement
Percent Crystallinity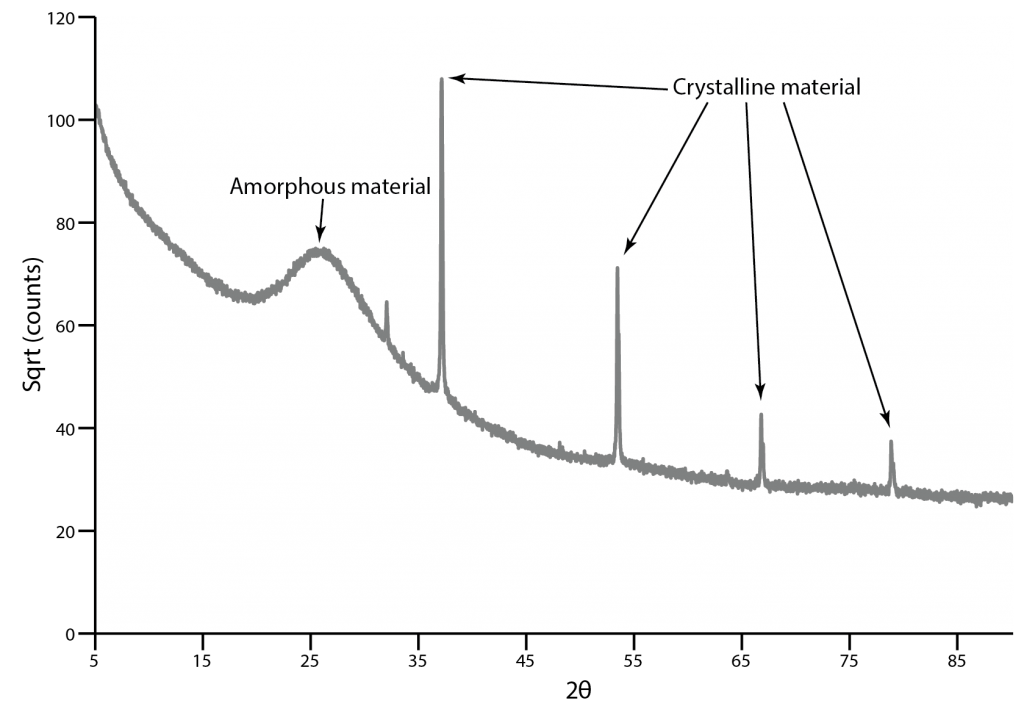
The relative amount of amorphous versus crystalline material within a sample is determined by performing a profile fitting and comparing the area attributed to the amorphous material to that of the crystalline material.
Conditions/Assumptions
- That the amorphous and crystalline material reflect x-rays with equal efficiency
Limitations
- Amorphous materials do not always reflect x-rays as efficiently as crystalline material
- The less amorphous material there is, the larger the error on the amorphous content estimation
Crystallite Size
The width of the peaks in a diffraction pattern are controlled by the crystallite size for that phase. The smaller the crystallites the broader the peaks become. Crystallite sizes for phases within a sample can be estimated by using the Sherrer Equation:
Conditions/Assumptions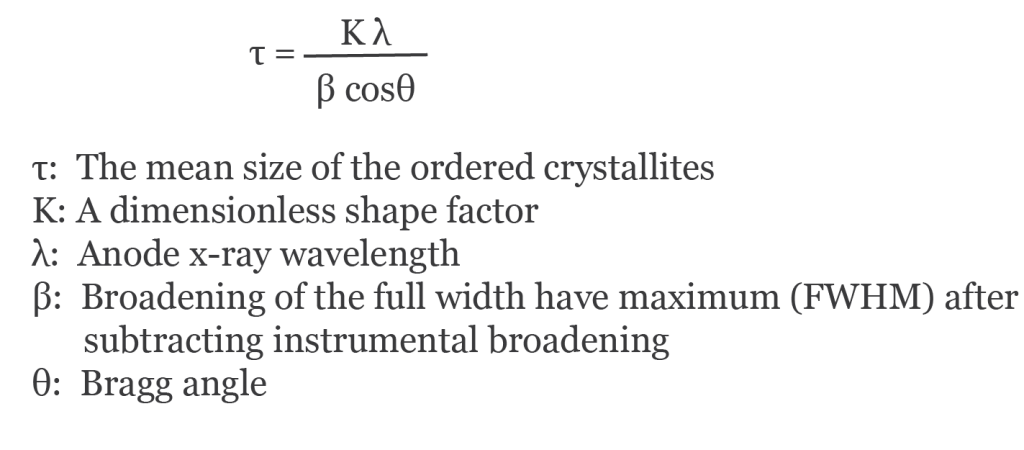
- Assumes spherical crystallites
- Assumes a normal crystallite distribution
Limitations
- Does not provide accurate dimensions of a non spherical crystallite